Using Table Column Features
Using Table Column Features
#380650
Each tabular reports provides a number of powerful features that enable you to review details on one or more systems to investigate issues highlighted by the Kubex analysis or to better understand how Kubex's recommendations can improve the health of your environment and save you money.
Creating Filters
You can create filters in many ways. Creating filters using the options in each column is the easiest way to quickly see the results. See Using Filters for details.
You can also create filters using the features in the tree viewer. See Creating Custom Filters.
Adding or Removing Columns
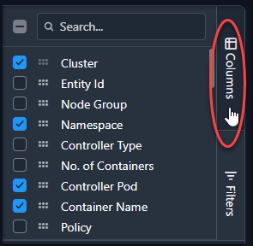
Expand the flyout menu on the right side of the page to see all of the available columns:
- All of the columns available for the selected table are displayed in this menu.
- Select or de-select columns to obtain the desired data set.
The table updates as you select or de-select columns in the flyout menu.
Creating Other Views
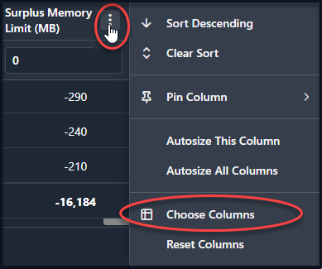
You can configure the table to display only the columns of interest.
- Access the column selection dialog box, from each column's context menu or from the icon on the right side of the page.
- Check the columns you want to see in your tabular view. Deselect the columns you do not want to see.
- You can search for a column. As you type the search criteria the list updates to show only the matching items.
- As you select columns, the table updates to show the selected columns.
- You can export your customized view.
- The selected table view settings are re-applied when you navigate away from this page.
|
Figure: Column Context Menu
|
Figure: Column Selection Dropdown Menu
|
See the following topics for more details:
Exporting Data
You can export tabular reports from this tab to Microsoft® Excel.
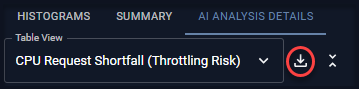
- Select the table view and adjust views and filters to obtain the desired set of data.
- Click the export icon, located beside the Table View drop down menu.
Figure: Export Button
When the content of the AI Analysis Details is exported, entity names that are provided as a hyperlink are included in the exported XLS file. When you open the exported .XLS file, the URL content initially appears as plain text, and when you click on the cell it becomes a hyperlink.
Moving Columns
Once you have all of the required columns in your table, you can move the columns around to again obtain the desired view.
Click on the header of the column and drag it left or right to the desired location.
Context Menu
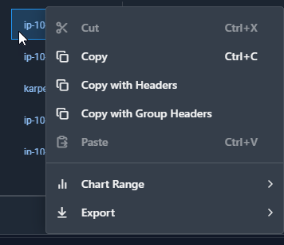
Right-click on any cell in the table to open a context menu with the following options.
|
Figure: Right-click Context Menu
|
|